Jan 19, 2026
Inside Shopify
AOV Benchmark vs Mix & Match adopters
What does “good AOV” look like for fashion brands? How much an AOV gap can quietly cost you?

Andrey Gadashevich
CMO | Cross-sell & Retention expert

If your AOV isn't growing, your profitability is shrinking. Here's a reality check for DTC fashion and lifestyle brands: the average ecommerce AOV hovers around $100-150 which is 15-30% lower than the potential.
Most brands believe their AOV is stuck because of industry averages, ad spending or product pricing. In reality, what really holds their AOV down is their static product pages.
According to Statista's data, the global average order value for online shopping sits at approximately $128. But here's what industry benchmarks don't tell you: they only reflect what static PDPs allow customers to spend, not what customers are willing to spend.
We see this pattern across every brand we analyze. When we analyze brands implementing interactive product detail page strategies like Mix & Match, we're seeing AOVs jump to $150-165 within the first month.
After implementing Mix & Match bundling for Nala's case, 10% of their total sales came from bundles each with significantly higher cart values than single-item purchases. Based on results from hundreds of brands using interactive bundling, this isn't a random success story.
The AOV Gap: Traditional vs Mix & Match Adopters
Your AOV isn't stuck because of ad costs or market saturation. It's stuck because your store treats products as isolated units rather than complete solutions. Traditional ecommerce setups create a predictable shopping experience: customers land on a product page, maybe add one item to cart, and check out. The result is lower AOVs that barely cover rising acquisition costs.
When acquisition costs rise faster than average order values, even premium brands see margin compression.
Consider these AOV benchmarks across fashion segments:
Fast fashion brands: Average AOV of $75-85
Mid-market fashion: Average AOV of $100-120
Premium lifestyle brands: Average AOV of $150-200
Now compare these to AOV of Mix & Match adopters in the same segments:
Fast fashion with Mix & Match: AOV increases to $95-110 (25% lift)
Mid-market with Mix & Match: AOV jumps to $125-155 (28% lift)
Premium brands with Mix & Match: AOV reaches $195-260 (30% lift)
What's the Revenue Opportunity You're Missing?
Let's say your brand is doing $200K monthly with $80 AOV (2,500 orders). Reaching $96-104 (20-30% uplift in AOV) means $40-60K in additional monthly revenue without spending more on ads.
That's $480-720K annually from the same customer base.
Why Mix & Match Outperforms Static Product Pages?
The psychology behind Mix & Match success is simple. When customers actively build their own bundles, they feel ownership over their choices, just like in offline stores. This engagement translates directly to larger purchases.
Think about online stores. They show groups of items, clothes, accessories, and more that fit well together. This helps shoppers see a full look and understand what matches well.
Across mid-market and premium brands, we consistently see Mix & Match outperform traditional upsell widgets because the psychology aligns with real consumer shopping patterns.
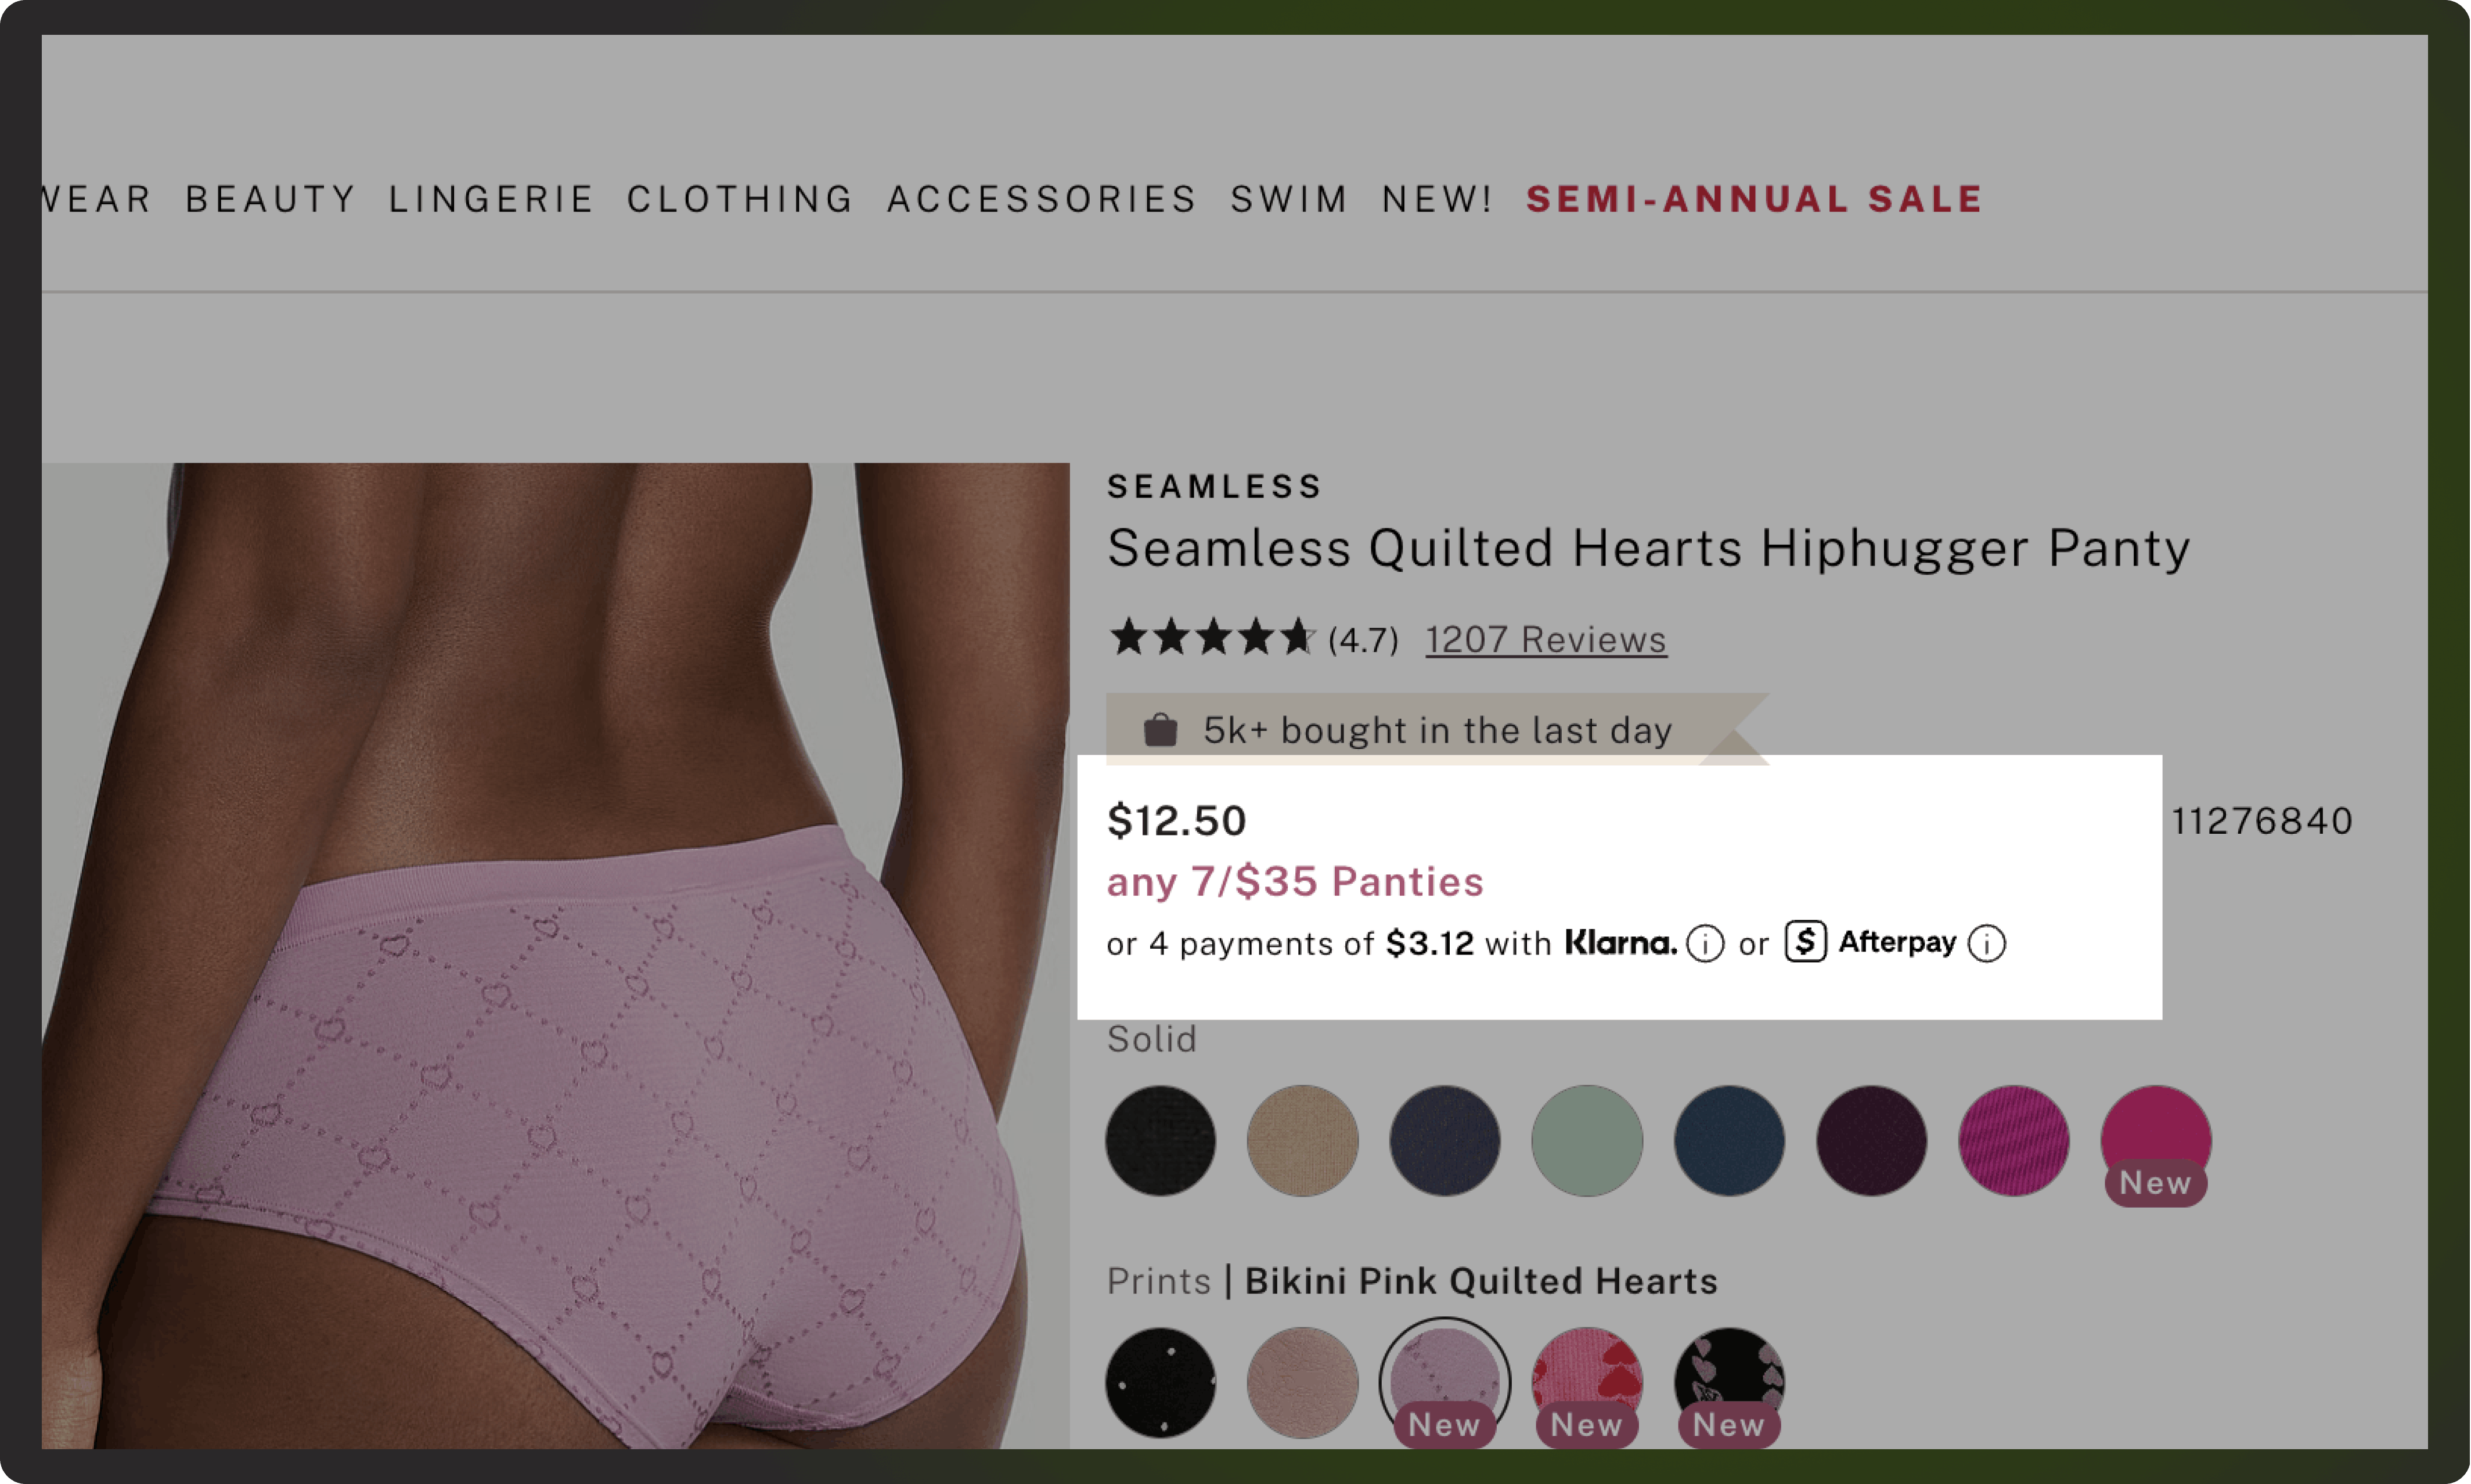
Victoria’s Secret’s real mix and match deal in their stores, like they do in their online stores. One pair of panties may cost $12.50, but at checkout they might offer 7 for $35. That is a real mix-and-match deal: shoppers are free to choose any color and pattern they like while getting discount for that. If this is not what shoppers are looking for, then what is it?
Mix & Match bundling works because it:
Creates a game-like shopping experience that keeps customers engaged
Reduces decision fatigue by guiding product combinations
Offers perceived value through bundle savings
Mimics the in-store experience of trying different combinations
Real Performance Metrics from Mix & Match Adopters
Brands implementing Mix & Match bundles see immediate AOV improvements. In most fashion verticals, a Mix & Match setup becomes the second-highest revenue generator within 30 days. The data shows consistent patterns across different fashion categories:
Underwear & basics: Mix & Match packs drive 10% of total sales with 25-35% higher AOV than single items
Activewear: Brands offering outfit bundles (top + bottom + accessories) see AOV increases of 40-50%
Accessories: Jewelry brands using "build your stack" features report 30% AOV lifts
Sustainable fashion: Complete capsule wardrobes generate 2-3x standard AOV
When customers can visualize complete looks and mix pieces themselves, they buy more confidently. They're not just adding items to cart, they're creating personalized solutions, they have more freedom to what to put in their baskets.
This isn't a marketing trick. It's a structural improvement to your commercial model. Mix & Match reduces decision fatigue. Instead of browsing dozens of separate product pages, customers build their selection in one interactive experience. This focused shopping journey leads to larger baskets and fewer abandoned carts.
Beyond the 10% bundle contribution to total sales, we're seeing consistent patterns across Mix & Match adopters:
Conversion rate improvements: Brands report 8-12% higher conversion rates on pages with Mix & Match options versus standard product pages. The interactive element keeps shoppers engaged longer, increasing purchase likelihood.
Return rate reduction: Mix & Match purchases show 15-20% lower return rates. When customers build their own combinations, they're more satisfied with their choices.
Repeat purchase behavior: Customers who buy through Mix & Match return 35% more often within 90 days. The positive first experience creates loyalty.
The Revenue Impact Calculator
Let's make this concrete for your brand. If you're currently doing $100,000 in monthly revenue with an AOV of $100, here's what Mix & Match could mean:
Conservative scenario (15% AOV lift): $15,000 additional monthly revenue
Average scenario (22% AOV lift): $22,000 additional monthly revenue
Best-case scenario (30% AOV lift): $30,000 additional monthly revenue
For brands at $500,000 monthly revenue, we're talking about $75,000 to $150,000 in additional revenue—without spending more on ads.
How Interactive Shopping with Mix & Match Increases AOV
Static product pages create artificial limits on order value. A customer looking at a single shirt sees only that shirt. They might click "you might also like" suggestions, but each click takes them away from purchase intent.
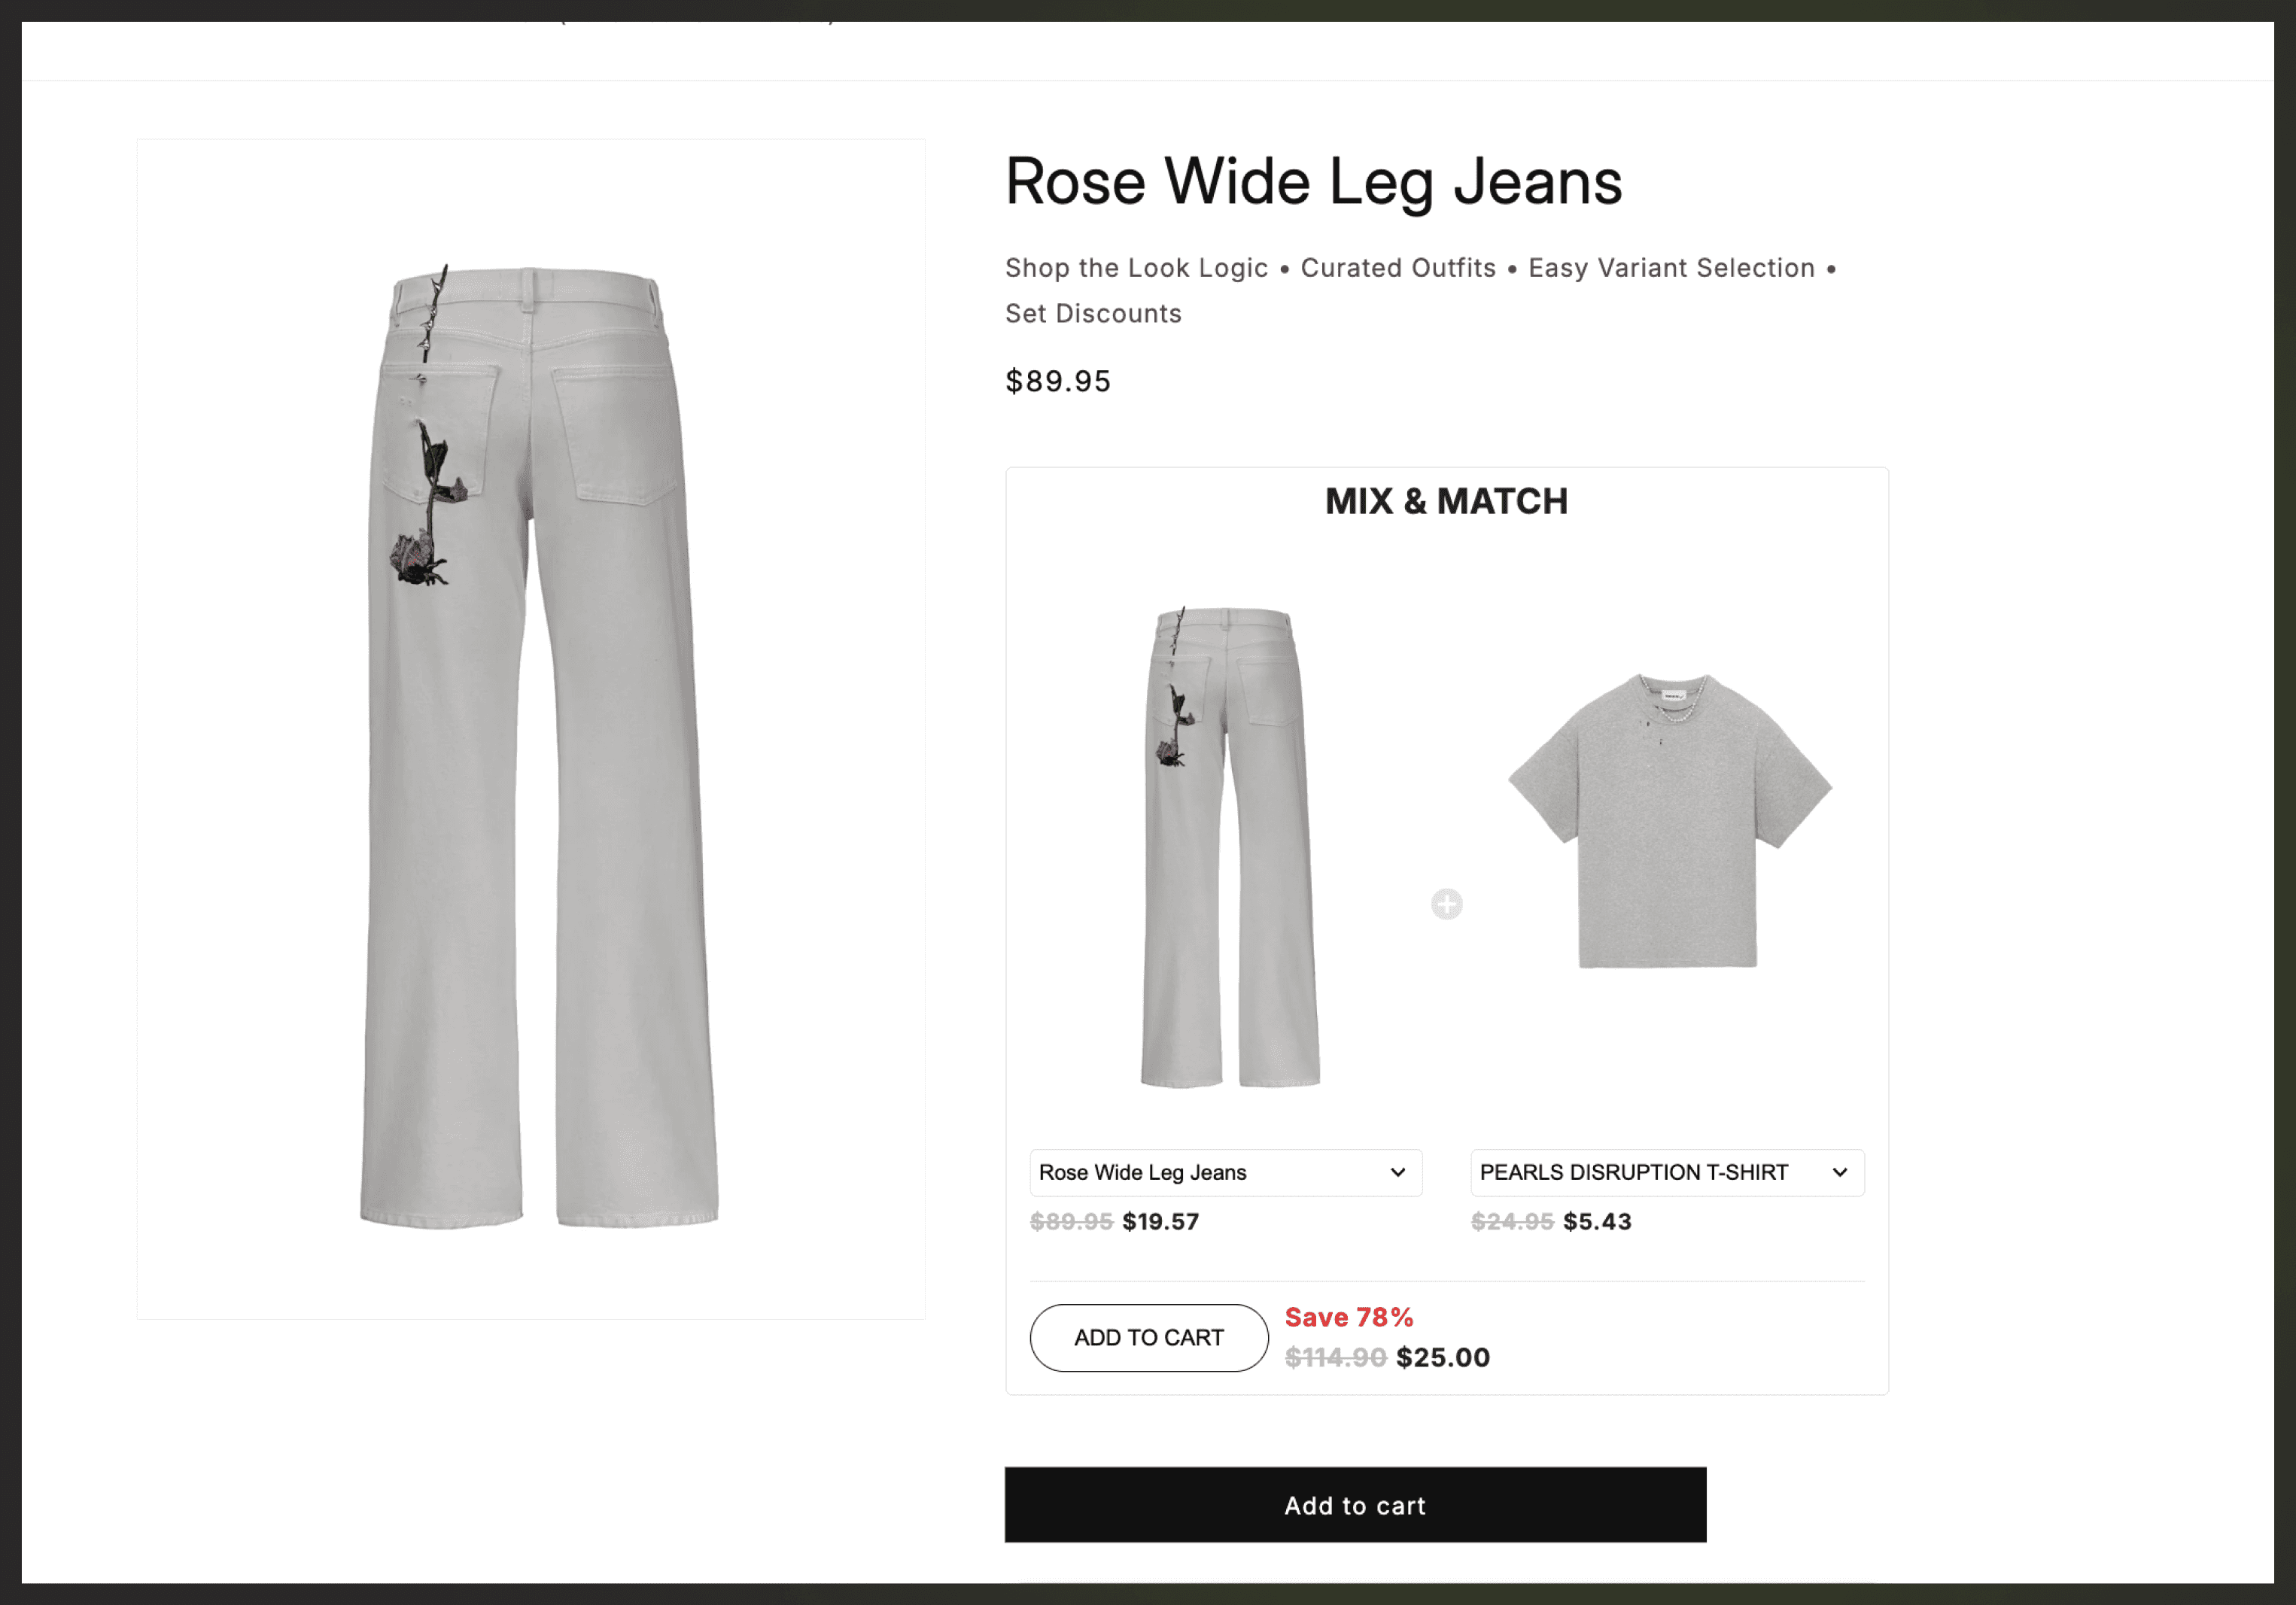
Interactive Mix & Match experiences work differently. Customers see possibilities, not just products. They experiment with combinations, discover new styles, and build complete outfits in real-time.
The results speak for themselves. Bundle buyers don't just spend more—they become better customers. Higher initial AOV correlates with improved lifetime value, lower return rates, and stronger brand loyalty.
Key Success Factors
For ecommerce managers and founders evaluating Mix & Match bundling, consider these factors:
ROI timeline: Most brands see positive ROI within 30-45 days of implementation.
Technical requirements: Bundling apps like MBC Bundles integrate seamlessly with Native Shopify API, requiring minimal technical resources.
Customer experience impact: Beyond revenue, Mix & Match improves key metrics like time on site and pages per session which create credibility for search engines and indirectly affect SEO.
Scalability: Unlike paid acquisition, Mix & Match improvements compound as your catalog grows.
Take the Next Steps
The question isn't whether Mix & Match works. It's how quickly you'll capture the upside.
If your current AOV is $120, even a 20% uplift pushes that to $144. At just 10,000 monthly orders, that's an extra $240,000 in revenue per month…without more ad spend, without new products, just by packaging what you already sell in a smarter way.
Your customers already reveal natural product pairings through their behavior. The key is making those combinations effortless to discover, the Playbook shows how to do it.
We've prepared a detailed Mix & Match Revenue Playbook that walks you through the exact steps we use to lift AOV by 15-30% in the first month.
Further Reading